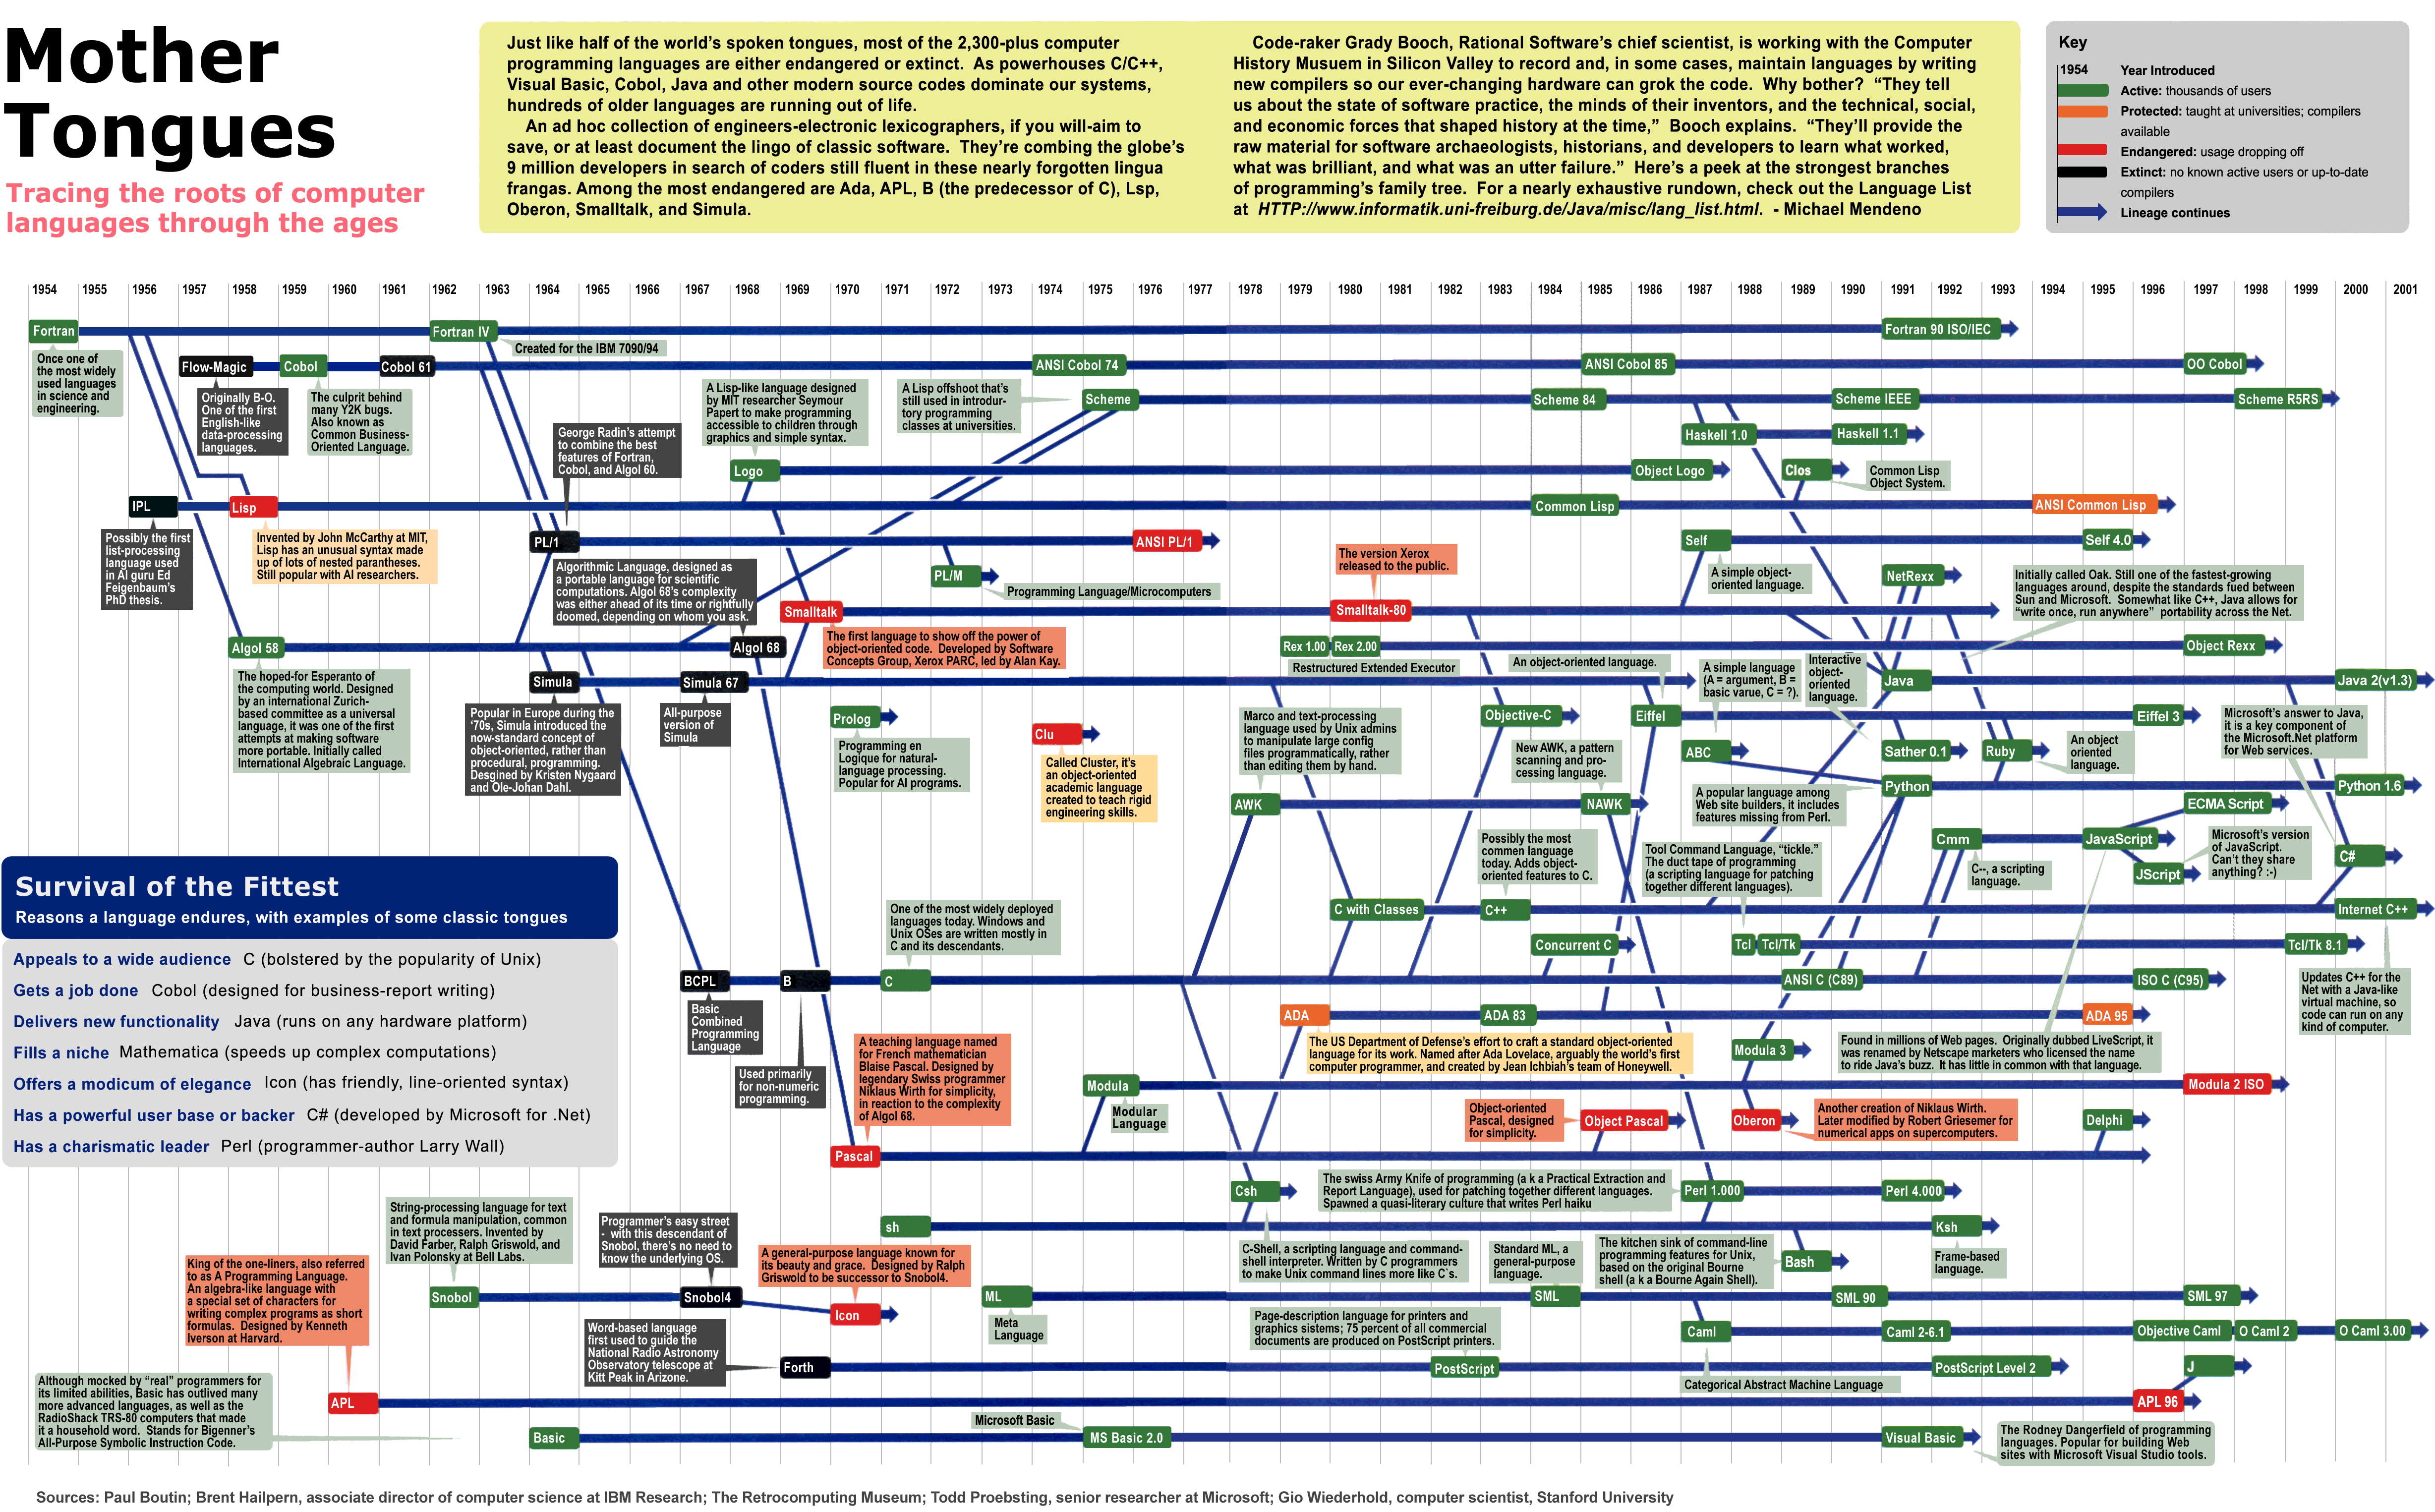
It quickly became apparent why I couldn't find such a chart.
I started by manually scraping the data from the Wikipedia pages and producing a spreadsheet of dependencies with:
- Language name
- Year it first appeared
- Ancestors (prior languages that are said to have influenced it)
- Link to Wikipedia page
That dataset (COCL: A Chronology of Computer Languages) is stored as JavaScript here. There are over sixty data points ranging from FORTRAN (1957) to Swift (2014). The choice of points is fairly subjective, the data is direct from Wikipedia.
Then I tried to draw the recombining tree (DAG) by hand. I got this far and gave up:

Even just concentrating on a subset (the "curlies") didn't help much:

The problem is that I'm trying to get the ordering of the chronology fixed in one of the axes (the y-axis in this case: oldest at the top, newest at the bottom). I've tried curved lines and even duplicated nodes to try to minimise the number of crossing edges. I've tried putting the oldest languages in the centre of the canvas and working outwards, like a bulls-eye. But nothing seems to work. I'm sure there are technique and/or software out there that can solve this problem, but the linear ordering seems to be beyond the ones I briefly looked at.
So I decided to throw a bit of JavaScript at it. It turns out it's easy to get ugly results from the dataset; the trick is to make it pretty.
My first attempt is an animated waterfall chart:

It's not very elegant, but does give some useful insights into popular ancestors. Everyone seems to want Lisp in their language's DNA these days.
Click here for the interactive version.

Another outdated visualization: https://www.cs.toronto.edu/~gpenn/csc324/PLhistory.pdf
ReplyDelete